Your campaigns are running. Your ROAS looks fine. Your revenue isn't moving. The problem isn't your budget. It's who Meta is spending it on.
Self-check · 30 seconds
Does this apply to your store right now?
-
ROAS looks fine (2× or above) but weekly revenue is flat or falling
-
Add-to-cart rate is decent but paid traffic CVR is under 1.5%
-
COD returns are eating into margins and you're not sure which campaigns are driving them
Tick any 2 of these and you have a low-intent traffic problem. Keep reading.
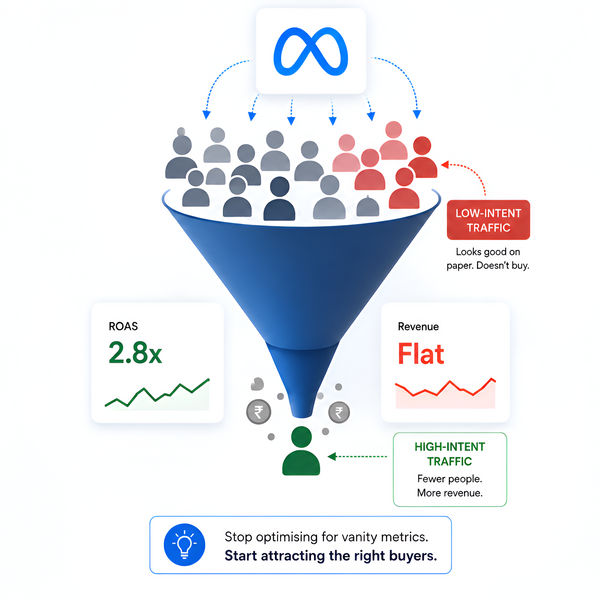
You open your Meta Ads dashboard on a Monday morning. ROAS is sitting at 2.8. CPM looks fine. CTR is decent. You close the tab feeling okay about things. Then you open Shopify. New orders are flat. Your best-selling SKU hasn't moved in three days. Your revenue this week is lower than last week, and last week wasn't great either.
So which number is lying to you?
Meta isn't. Meta is reporting exactly what it measured. The real issue is that those metrics, like clicks, impressions, and attributed conversions, don’t always translate to actual impact the way you assume. You could be running a technically healthy campaign that is, in practice, burning money on people who were never going to buy.
This is the low-intent traffic problem. And it's costing Indian D2C brands crores every month. And most founders don't catch it until the damage is done.
The Framework
Phantom Demand: The Signal vs. Intent Gap
Signal (what Meta measures)
Clicks · Page views · Add-to-cart · Initiate checkout · Link CTR
Intent (what actually matters)
Real buying motivation · Willingness to pay · Likelihood to follow through
The gap between these two is where your budget disappears. Meta is very good at finding signal. It has no way of measuring intent. That's your job.
Five signs you have phantom demand in your funnel
These patterns show up in your data before your revenue tells you something is wrong. Benchmark your store against each one.
| Signal | Red flag | What good looks like | What it means |
|---|---|---|---|
| CTR vs paid CVR gap | CTR >1.5% and paid CVR <1.5% | Paid CVR 1.5–3% | Audience problem, not a creative problem. Wrong people clicking, not a wrong ad. |
| ATC to purchase drop-off | >70% drop-off | <50% drop-off | Low-intent browsers adding to cart with no real purchase motivation. |
| Returning visitor rate from paid | <12% | 20–30% | Your ads aren't building an audience. You're renting attention from people with no brand affinity. |
| COD RTO rate, tier-3 | >25% | <15% | Meta's broad audiences in tier-3 geographies include high-engagement, low-intent users. |
| ROAS stable, margin falling | ROAS flat + net margin declining | Both trending together | Traffic quality has degraded silently. ROAS is a ratio — it can look fine while you're losing money. |
Where to check these numbers
Shopify Analytics
- Paid traffic CVR
- ATC to purchase drop-off
- Average order value
- COD vs prepaid split
Meta Ads Manager
- CTR (link clicks)
- CPM by audience
- Add-to-cart events
- Purchase attribution
GA4
- New vs returning visitors
- Paid traffic session quality
- Bounce rate by source
- City-tier breakdown
Why this happens
Meta's algorithm does exactly what you tell it to. Three structural reasons phantom demand sneaks in:
Reason 1
Broad retargeting windows Someone who bounced from your homepage nine weeks ago is not a warm lead. Retargeting them costs the same as retargeting someone who added to cart yesterday. A 180-day window is a cold audience wearing a retargeting label.
Reason 2
Optimising for the wrong event = If your pixel doesn't have enough purchase data, true for most brands under ₹1Cr/month. Meta falls back to optimising for ATC or view content. Both are populated by low-intent behaviour far more than purchases. You're training the algorithm on the wrong signal.
Reason 3
Lookalike audiences built on shallow data A 1% lookalike of your actual buyers is valuable. A 5% lookalike of your site visitors includes every bounce, accidental click, and wrong-audience impression you've ever served. The larger the lookalike, the more diluted the intent.
"Meta optimises for signals of intent, not intent itself. That distinction is where your budget either works or disappears."
Real example: Sudathi Sarees
Sudathi is a Surat-based saree brand — 6L+ customers, Shark Tank India S4 deal, fast-growing. Their problem wasn't reach. It was that their retargeting was chasing every site visitor equally, and high-intent shoppers were dropping off before buying.
Two things changed. First, they stopped showing the same static collection to everyone and started surfacing SKUs based on actual intent signals, showing discounted styles to cart abandoners, and new arrivals to repeat visitors. Second, they narrowed their retargeting to high-intent visitors only instead of their entire site traffic pool.
In Viren Lathiya's words, Co-founder of Sudathi
"We hit ROAS ~10 on our retargeting ads in just 2 days. It's been 3 months and we've already achieved our yearly growth goals."
 Fix it in this order
Don't try to fix everything at once. These changes are sequenced by speed of impact.
-
1
Tighten your retargeting window Fastest win
Move from 180-day to 14-day and 30-day windows. Run them as separate ad sets for one week and compare paid CVR. The shorter windows will almost always outperform. Smaller audience, but people who actually remember you. Do this before anything else. Then pause your 180-day retargeting entirely for 7 days and compare what happens to revenue.
-
2
Stop optimising for ATC. Switch to purchase. Biggest impact
Even if purchase volume is low. Meta will take longer to exit the learning phase but it will find buyers, not just clickers. If you have under 50 purchases per week, combine 3 to 6 months of buyer data into one seed audience to compensate for low signal volume.
-
3
Delete lookalikes built from site visitors. Rebuild from buyers only. Scale lever
Start fresh with a lookalike seeded from purchasers only. Use 1% for prospecting. If the audience is too small, expand to 2% maximum. Quality degrades fast as you widen beyond that.
-
4
Split COD and prepaid. Measure each separately. Profit clarity
Run a ₹20,000 prepaid-only campaign to a warm 14-day audience. Compare RTO and effective margin against your COD traffic. Many brands discover COD acquisition isn't profitable end-to-end once RTO costs are included.Operator truths
"More budget does not fix a traffic quality problem. It amplifies it."
"ROAS is a ratio. It can look healthy while your business is quietly bleeding."
"You're not optimising ads. You're teaching an algorithm who your buyers are. Give it the right lesson."
The only thing you need to do every week
You don't need a data team or a new tool. You need four numbers, checked every Monday, from tools you already have. Everything else in this playbook flows from these.
Weekly audit template
Every Monday, before you open Meta Ads
Paid traffic conversion rate
Shopify Analytics → Sessions by traffic source → filter to Paid Social
ATC to purchase drop-off %
Shopify Analytics → Sales funnel report. Formula: (ATCs minus Purchases) divided by ATCs
COD share and RTO rate this week
Shopify Orders → filter by payment method and fulfilment status (returned)
Returning visitor rate from paid traffic
GA4 → Acquisition → Traffic acquisition → filter Paid Social → New vs returning
If any of these numbers hit the red zone from the table above, that is where you start. Not with a new campaign. Not with new creative. With the audience.
If your ROAS looks fine but your bank account disagrees, you don't have a scaling problem. You have a signal problem